Violent Crime
Definition
In the FBI’s Uniform Crime Reporting (UCR) Program, violent crime is composed of four offenses: murder and nonnegligent manslaughter, rape, robbery, and aggravated assault. Violent crimes are defined in the UCR Program as those offenses that involve force or threat of force.
Data collection
The data presented in Crime in the United States reflect the Hierarchy Rule, which requires that only the most serious offense in a multiple-offense criminal incident be counted. The descending order of UCR violent crimes are murder and nonnegligent manslaughter, rape, robbery, and aggravated assault, followed by the property crimes of burglary, larceny-theft, and motor vehicle theft. Although arson is also a property crime, the Hierarchy Rule does not apply to the offense of arson. In cases in which an arson occurs in conjunction with another violent or property crime, both the arson and the additional crime are reported.
In 2016, the FBI Director approved the recommendation to discontinue reporting of rape data using the UCR legacy definition beginning in 2017. However, to maintain the 20-year trend in Table 1, the rape total for the legacy definition is used to calculate the violent crime total.
Overview
- In 2017, an estimated 1,247,321 violent crimes occurred nationwide, a decrease of 0.2 percent from the 2016 estimate. (See Tables 1 and 1A.)
- When considering 5- and 10-year trends, the 2017 estimated violent crime total was 6.8 percent above the 2013 level but 10.6 percent below the 2008 level. (See Tables 1 and 1A.)
- There were an estimated 382.9 violent crimes per 100,000 inhabitants in 2017, a rate that fell 0.9 percent when compared with the 2016 estimated violent crime rate and dropped 16.5 percent from the 2008 estimate. (See Tables 1 and 1A.)
- Aggravated assaults accounted for 65.0 percent of violent crimes reported to law enforcement in 2017. Robbery offenses accounted for 25.6 percent of violent crime offenses; rape (legacy definition) accounted for 8.0 percent; and murder accounted for 1.4 percent. (Based on Table 1.)
- Information collected regarding types of weapons used in violent crime showed that firearms were used in 72.6 percent of the nation’s murders, 40.6 percent of robberies, and 26.3 percent of aggravated assaults. (Weapons data are not collected for rape.) (See Expanded Homicide Data Table 7, Robbery Table 3, and the Aggravated Assault Table.)
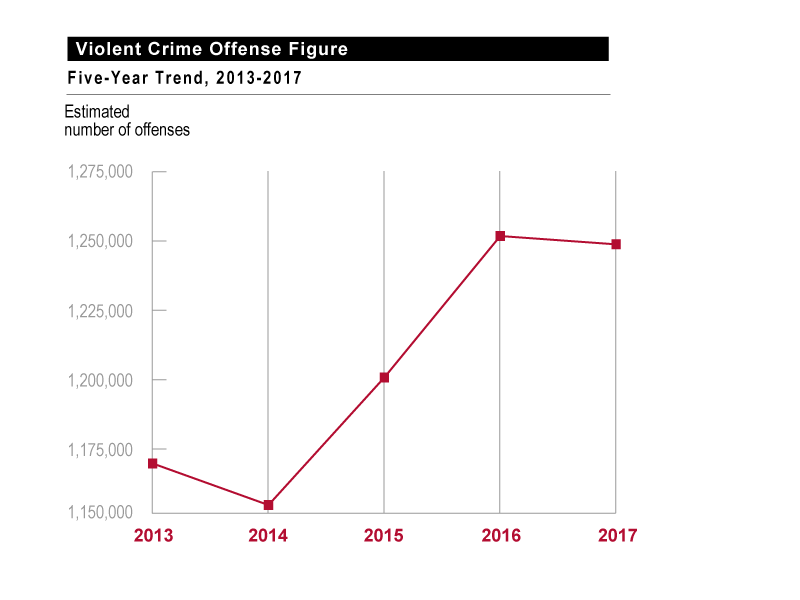
Violent Crime Figure
This figure is a line graph that presents trends in the estimated number of violent crimes for the nation from 2013 through 2017. In 2013, there were 1,168,298 violent crimes. In 2014, there were 1,153,022 violent crimes. In 2015, there were 1,199,310 violent crimes. In 2016, there were 1,250,162 violent crimes. In 2017, there were 1,247,321 violent crimes. The figure is based on statistics from Table 1.

Murder
Rape
Robbery
Aggravated Assault
Metropolitan Statistical Areas (MSAs) (Table 6)
Expanded Offense Data

