Region
Offense data by region
Table 3–Crime in the United States, Offense and Population Percent Distribution by Region, 2019
Table 4–Crime in the United States, by Region, Geographic Division, and State, 2018–2019

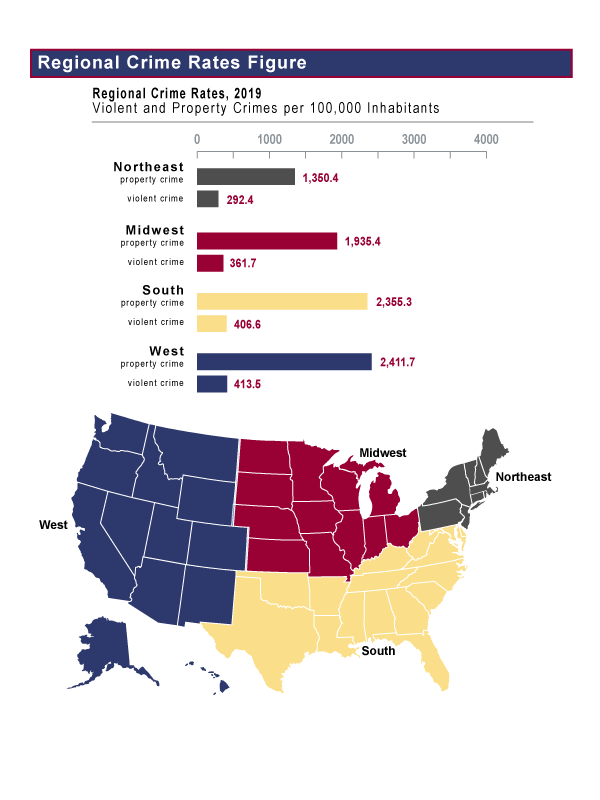
This figure is a bar graph that presents the number of property and violent crimes per 100,000 inhabitants for the four regions of the nation in 2019, along with a map that defines the four regions by shading. The regional rates for violent and property crimes per 100,000 inhabitants were as follows: in the Northeast, 1,350.4 property crimes and 292.4 violent crimes; in the Midwest, 1,935.4 property crimes and 361.7 violent crimes; in the South, 2,355.3 property crimes and 406.6 violent crimes; and in the West, 2,411.7 property crimes and 413.5 violent crimes. The statistics for this figure are derived from Table 4.

