Crime Map

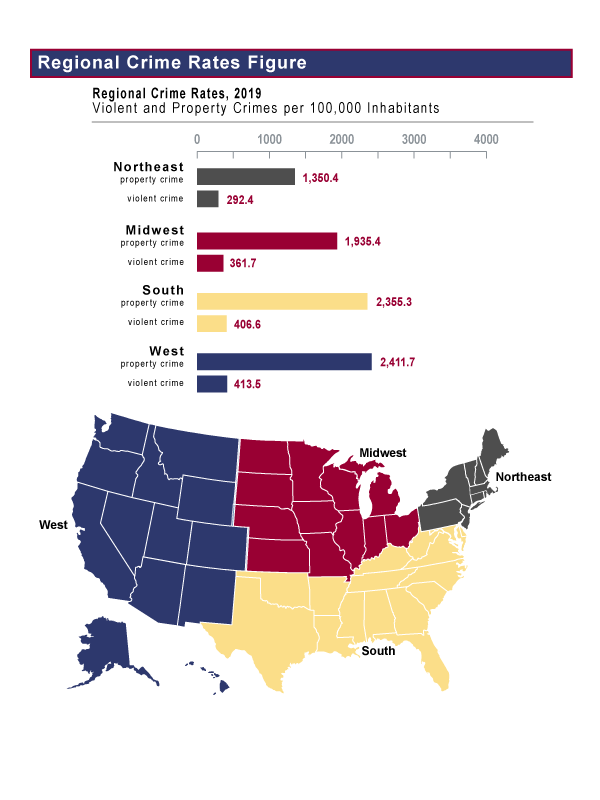
This figure is a bar graph that presents the number of property and violent crimes per 100,000 inhabitants for the four regions of the nation in 2019, along with a map that defines the four regions by shading. The regional rates for violent and property crimes per 100,000 inhabitants were as follows: in the Northeast, 1,350.4 property crimes and 292.4 violent crimes; in the Midwest, 1,935.4 property crimes and 361.7 violent crimes; in the South, 2,355.3 property crimes and 406.6 violent crimes; and in the West, 2,411.7 property crimes and 413.5 violent crimes. The statistics for this figure are derived from Table 4.

