National Data
National Clearance Data
Table 25 - “Percent of Offenses Cleared by Arrest or Exceptional Means, by Population Group, 2015”
Table 26 - “Percent of Offenses Cleared by Arrest or Exceptional Means, by Region and Geographic Division, 2015”
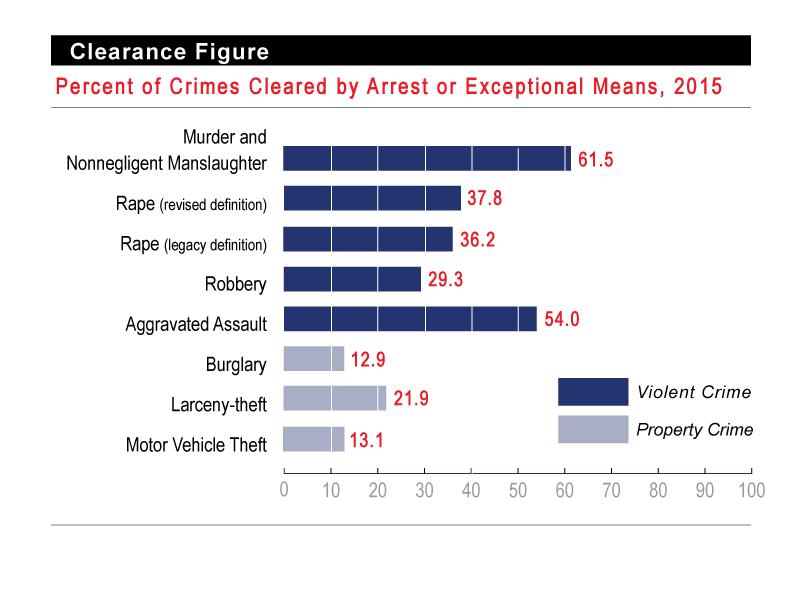
Clearance Figure - “Crimes Cleared by Arrest or Exceptional Means, 2015”

This figure shows the percentages of violent and property crimes cleared by arrest or exceptional means in 2015. Among violent crimes, the individual offenses and their respective clearance percentages are murder and nonnegligent manslaughter, 61.5 percent; rape (revised definition), 37.8 percent; rape (legacy definition) 36.2 percent; robbery, 29.3 percent; and aggravated assault, 54.0 percent. Of property crimes, the individual offenses and their respective clearance percentages are burglary, 12.9 percent; larceny-theft, 21.9 percent; and motor vehicle theft, 13.1 percent.

